So you found some COVID DATA...now what?
Choose a path
check_circle 
Show the total confirmed cases, recovered cases, and total deaths in the US.
OR
check_circle 
Visualize the volume of confirmed coronavirus cases, in Canada, across gender and age group.
Select a path above to learn how RDS can help, or scroll down and get right to the code!
You have a few hurdles to overcome...
Select an option above to view necessary steps
Sure, you could do all that...
Before you go to all that trouble, check out how easy it can be with the RDS API.
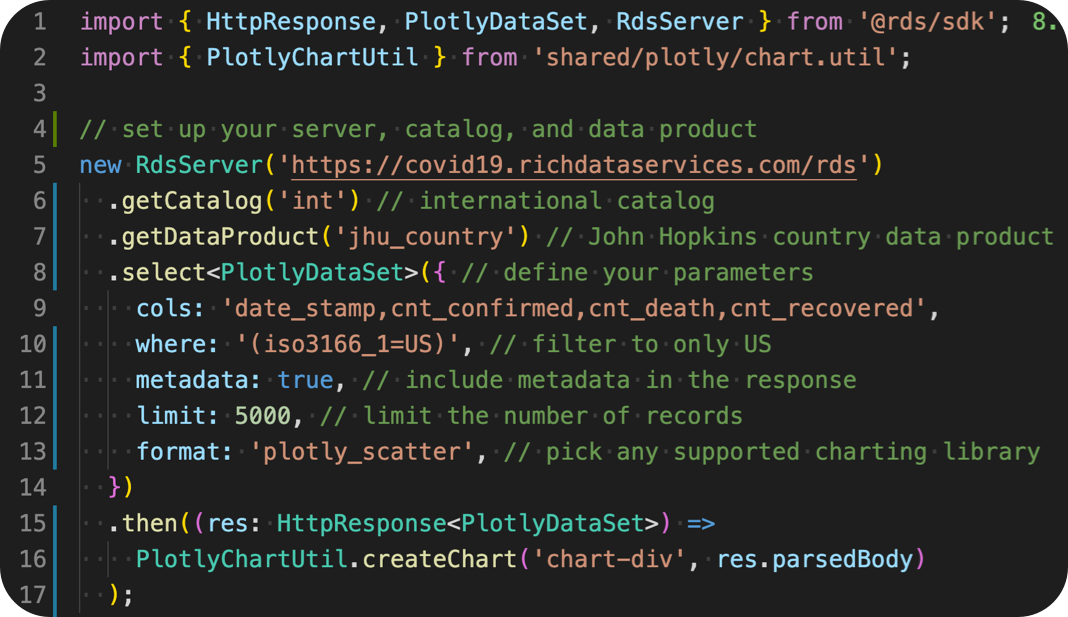
Total cases confirmed, recovered, and deaths
The data we are using for this visualization has already been aggregated to indicate the total counts per day.
- check_circleA single RDS API query
- check_circleNo more parsing various data files
- check_circleNo need to keep up with the data each time it changes
- check_circleSwitching charting libraries is as simple as changing one paramter
Try a different charting library, it's easy!
Chart Type
RDS Explorer
Use our powerful and feature-packed interface to easily view, search, and examine data. Filter, package, and download custom sub-views in popular data formats.
ExploreRDS Tabulation Engine
Create custom cross tabulations with the RDS Tabulation Engine. Filter, weight, and organize the table how you want in our easy-to-use interface.
TabulateNeed help working with your data?
You don’t need your own internal development team to take advantage of the benefits of the Rich Data Services API.
Get In Touch.
Get In Touch.